|
||||||||||||||
|
Name
Cash Bids
Market Data
News
Ag Commentary
Weather
Resources
|

Chart of the Day - December Corn
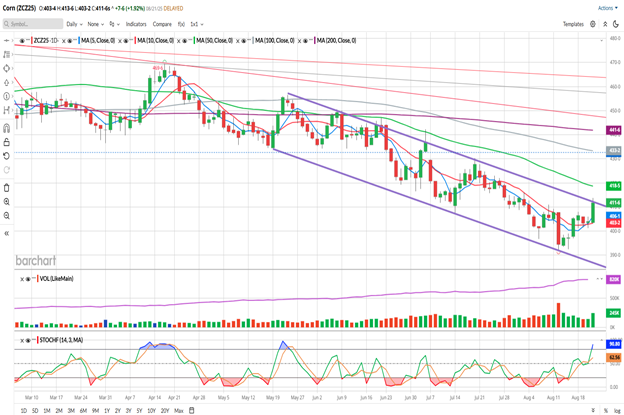
The information and opinions expressed below are based on my analysis of price behavior and chart activity Thursday, August 21, 2025 If you like this article and would like to receive more information on the commodity markets from Walsh Trading, please use the link to join our email list -Click here Every morning, at about 8 AM CST, I post a short video highlighting where I see opportunities in the futures markets. You can view my most recent video here December Corn (Daily)
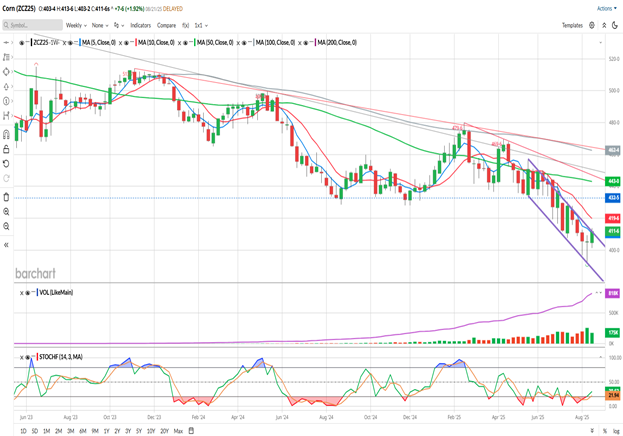
Today, December Corn closed at 4.11 ½, up 7 ¾ cents on the day. Since the bearish close following the USDA’s WASDE report on Tuesday of last week, Corn prices have gained 17 ¼ cents. Some market participants may be surprised by the recent strength, considering that the USDA pegged this year’s Corn crop at a new record of 16.7 billion bushels. To add to the bearish news, this week we’re hearing reports from a prominent crop tour, essentially confirming that the harvest will be huge. But in the face of all that, prices have rallied some. The rally may be spurred by a few reasons that I can think of. First off, “selling the rumor and buying the fact” is a real thing, in my opinion. Now, I’ve taken an old adage and kind of flipped it around. “Buy the rumor and sell the fact” was the way it was taught to me as I started in this business in the 90’s. I also believe that the way I phrased it can be true. I think that it’s safe to say that nearly everyone involved in the Corn market was aware that the prospects for a large crop were there. Planted acreage was higher this past spring, which would usually result in more bushels, barring a crop failure or widespread weather issues. And Grain market watchers (speculators, farmers, end users, etc.) should be aware that this year’s growing season weather has been quite favorable nationwide. Nearly all of the producers that I speak with have been telling me that the crops look great and they been saying that for at least 2 months. Yes, some localized areas have had some excessive or untimely rains and other areas are a bit dry, but on balance the weather has been very good across the Corn Belt. There’s still sometime before harvest really kicks in, but current forecasts don’t seem threatening, to my eye. Second, there are many folks that watch the Export Sales data for clues as to who is buying our grain. And many of those export-sales-watchers are of the opinion, right or wrong, that any destination that is listed as “unknown” eventually ends up in China. This past week alone, the bulk of the Corn sales, 949,000 metric tons, were listed as “unknown.” Will those eventually end up in China? Honestly, I have no idea, but I do agree that it is possible. I’ve noticed that, in the past, those sales are reclassified just before shipment overseas, and sometimes they are attributed to China. We’ll have to stay tuned for that to play out. So we’ve got confirmation of a record crop and export sales data is not suffering. I think many market participants have recently asked themselves “how much lower can we go?” and “how much larger can the crop get?” The answer to the first one is a dicey one, I think. After all, last year’s Dec Corn contract traded as low as 3.85 last year on August 27th, before beginning a harvest rally to go off the board at 4.30. We could still see prices head down there, or lower, should there be no issues with harvest. Our crop this year is about a billion bushels larger than last. But the answer to the second question, I think, is “not much.” It seems unlikely to me that yields could or would increase substantially from here on out. The Corn crop should be made by now and additional bushels, above 16.7 billion, will be hard to come by, I think. Any reductions in national yield should reduce the crop size and be bullish, at least on paper. To recap, the “rumor” was that the crop would be huge, and that “fact” was the USDA’s confirmation of that. Many traders and hedgers were short the market and have been choosing to lift those positions over the past week or so. Harvest lows have been moving forward on the calendar, as well. Over the past 30 years, Corn typically made the low right around October 2nd. The 15-year pattern moved that up to about September 23rd. The 5-year pattern indicates an average low about August 8th. It is possible we’ve already seen the low for this year. I think that it also adds to the mildly bullish sentiment that the 4.00 level has, so far, held as support. By looking at the chart above, you may notice that purple trend channel that I’ve drawn on there. Prices have gone from the lower end of that channel to the upper end is just a week or so. That also happened in mid-July and hindsight says that would have been a good selling opportunity. In fact, the first 4 times that Corn has hit the top of that channel, it failed to break through and go higher. Will this 5th time be a charm for the Corn bulls out there? The long-term moving averages displayed, the 50-, 100- and 200-day averages, (green, grey, purple and 4.18 5/8, 4.33 ¼ and 4.41 ¾, respectively) are all above the market and still declining. The 100-day roughly corresponds with the price gap left from July 3rd to the 7th, which is at 4.32 3/4 and denoted by the horizonal blue dashed line. The short-term averages on the chart, the 5- and 10-day, (blue/red, 4.03 ¼ and 4.06 1/8, respectively) made a bullish crossover with yesterday’s trade and are now below the market, offering potential support. Those have been on the bearish side since July 25th. The last bullish cross those averages had, on July 18th, was also at the high side of the channel. To my eye, the bullish cross hasn’t really been an effective signal since April and the bearish cross of those averages has at least kept to the “right” side of the trend. Stochastics (bottom sub-graph) have just gotten into overbought territory. The Corn market hasn’t stayed overbought for very long this year, only 1 7-day period and 1 2-day period over the life of this chart, and appears to stay content to revert to oversold most of the time. More red than blue on the indicator. Aggressive and well- margined traders may choose to establish long futures positions in December Corn. I’ll leave the entry point up to you, but I do think that your risk/reverse stop should be near this week’s low of 4.01 ¼, and perhaps just below 4.00, in case that big, fat, round number is tested again. From today’s close to 4.01 ¼ would be a risk of $525, before your commissions/fees. Perhaps targets to the upside, near 4.18 (50-day average) or the 4.33 mark (price gap and 100-day average) would be effective for you. Less aggressive traders may do well to consider purchasing December 4.30 Call options. Those have 92 days until expiration and settled at 7 5/8 cents, or $381.25 before your commissions/fees. I would suggest placing a GTC order to take profit at 2x what you pay for the option. Corn producers that are still worried about downside risk, may do well to consider December 3.95 Put options. Those also have 92 days to expiration and closed at 7 ¼ cents, or $362.50 before your commissions/fees. Like the call options above, place a GTC order at 2x what you paid for the option to exit. Mind the Delta on those options, as they won’t move 1:1 with the futures. If you’re looking to cover a certain number of bushels, be sure to purchase enough to get the Delta closer to 1. If you like what you’ve read here and would like to see more like this from Walsh Trading, please Click here and sign up for our daily futures market email. Every morning, at about 8 AM CST, I post a short video highlighting where I see opportunities in the futures markets. You can view my most recent video here December Corn (Weekly)
If you’re interested, you can find Barchart’s Seasonal data for December Corn here. If you like what you’ve read here and would like to see more like this from Walsh Trading, please Click here and sign up for our daily futures market email. Every morning, at about 8 AM CST, I post a short video highlighting where I see opportunities in the futures markets. You can view my most recent video here Jefferson Fosse Walsh Trading Direct 312 957 8248 Toll Free 800 556 9411 jfosse@walshtrading.com www.walshtrading.com Walsh Trading, Inc. is registered as a Guaranteed Introducing Broker with the Commodity Futures Trading Commission and an NFA Member. Futures and options trading involves substantial risk and is not suitable for all investors. Therefore, individuals should carefully consider their financial condition in deciding whether to trade. Option traders should be aware that the exercise of a long option will result in a futures position. The valuation of futures and options may fluctuate, and as a result, clients may lose more than their original investment. The information contained on this site is the opinion of the writer or was obtained from sources cited within the commentary. The impact on market prices due to seasonal or market cycles and current news events may already be reflected in market prices. PAST PERFORMANCE IS NOT NECESSARILY INDICATIVE OF FUTURE RESULTS. All information, communications, publications, and reports, including this specific material, used and distributed by Walsh Trading, Inc. (“WTI”) shall be construed as a solicitation for entering into a derivatives transaction. WTI does not distribute research reports, employ research analysts, or maintain a research department as defined in CFTC Regulation 1.71. This article contains syndicated content. We have not reviewed, approved, or endorsed the content, and may receive compensation for placement of the content on this site. For more information please view the Barchart Disclosure Policy here.
|
|
|